Page History
A data flow diagram (DFD) shows how data is processed within a system based on inputs and outputs. Visual symbols are used to represent the flow of information, data sources and destinations, and where data is stored. There are two main types of notation used for data flow diagrams: Yourdon-Coad and Gane-Sarson, both named after their creators.
There are four main elements of all data flow diagrams: entity, process, data store and data flow.
External Entity is known as actors, sources or sinks, and terminators, external entities produce and consume data that flows between the entity and the system being diagrammed. These data flows are the inputs and outputs of the DFD.
Process is an activity that changes or transforms data flows. In Gane-Sarson notation, a rectangular box is used and may be labeled with a reference number, location of where in the system the process occurs and a short title that describes its function.
Data Store is a data store which does not generate any operations but simply holds data for later access. Input flows to a data store include information or operations that change the stored data. Output flows would be data retrieved from the store.
Data Flow is a movement of data between external entities, processes and data stores is represented with an arrow symbol, which indicates the direction of flow.
1. Data
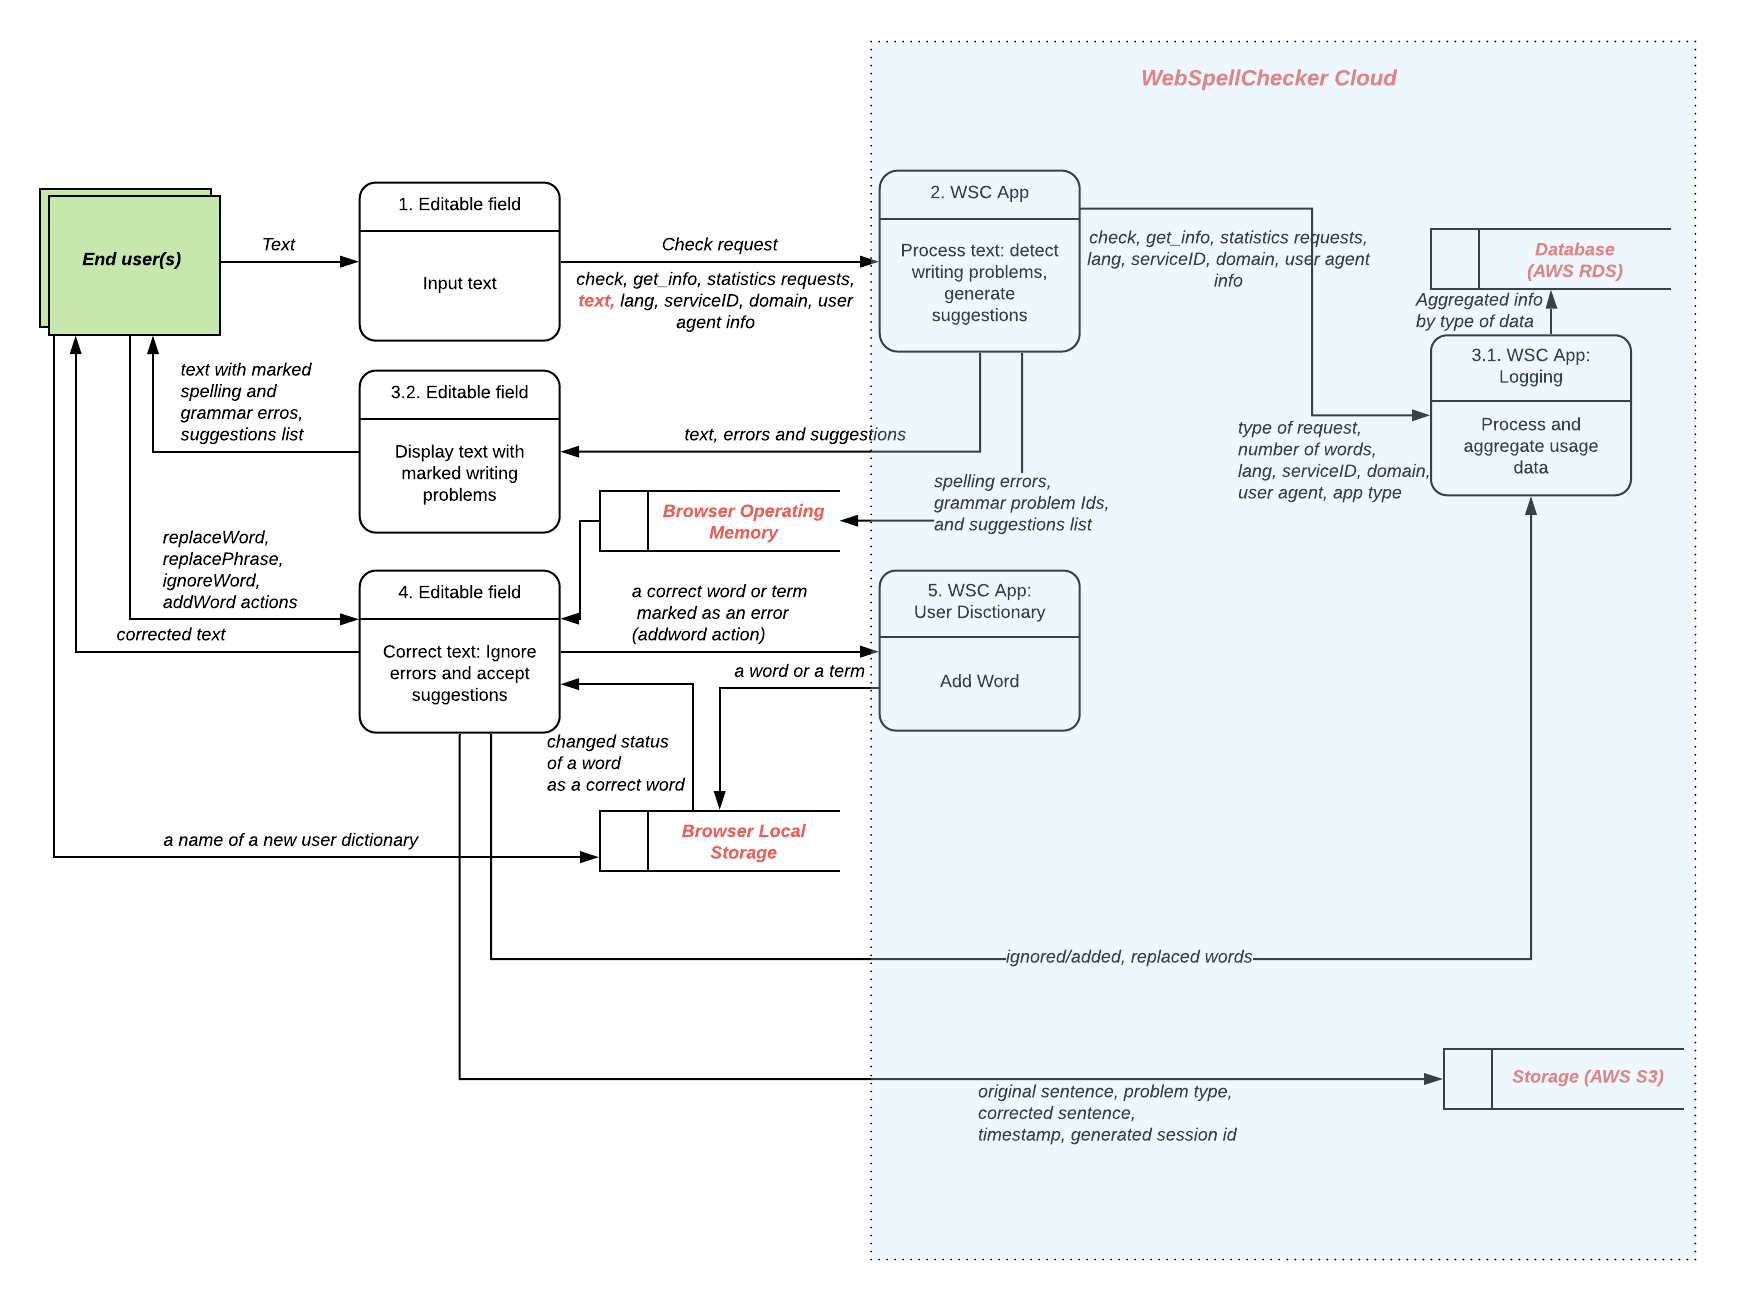
Flow Diagram for Cloud Free Usersflow diagram for cloud free users
| Tip | ||
|---|---|---|
| ||
|
The next diagram represents the data flow between client sessions for end users who are using the free version of the WebSpellChecker Cloud services.
2. Data
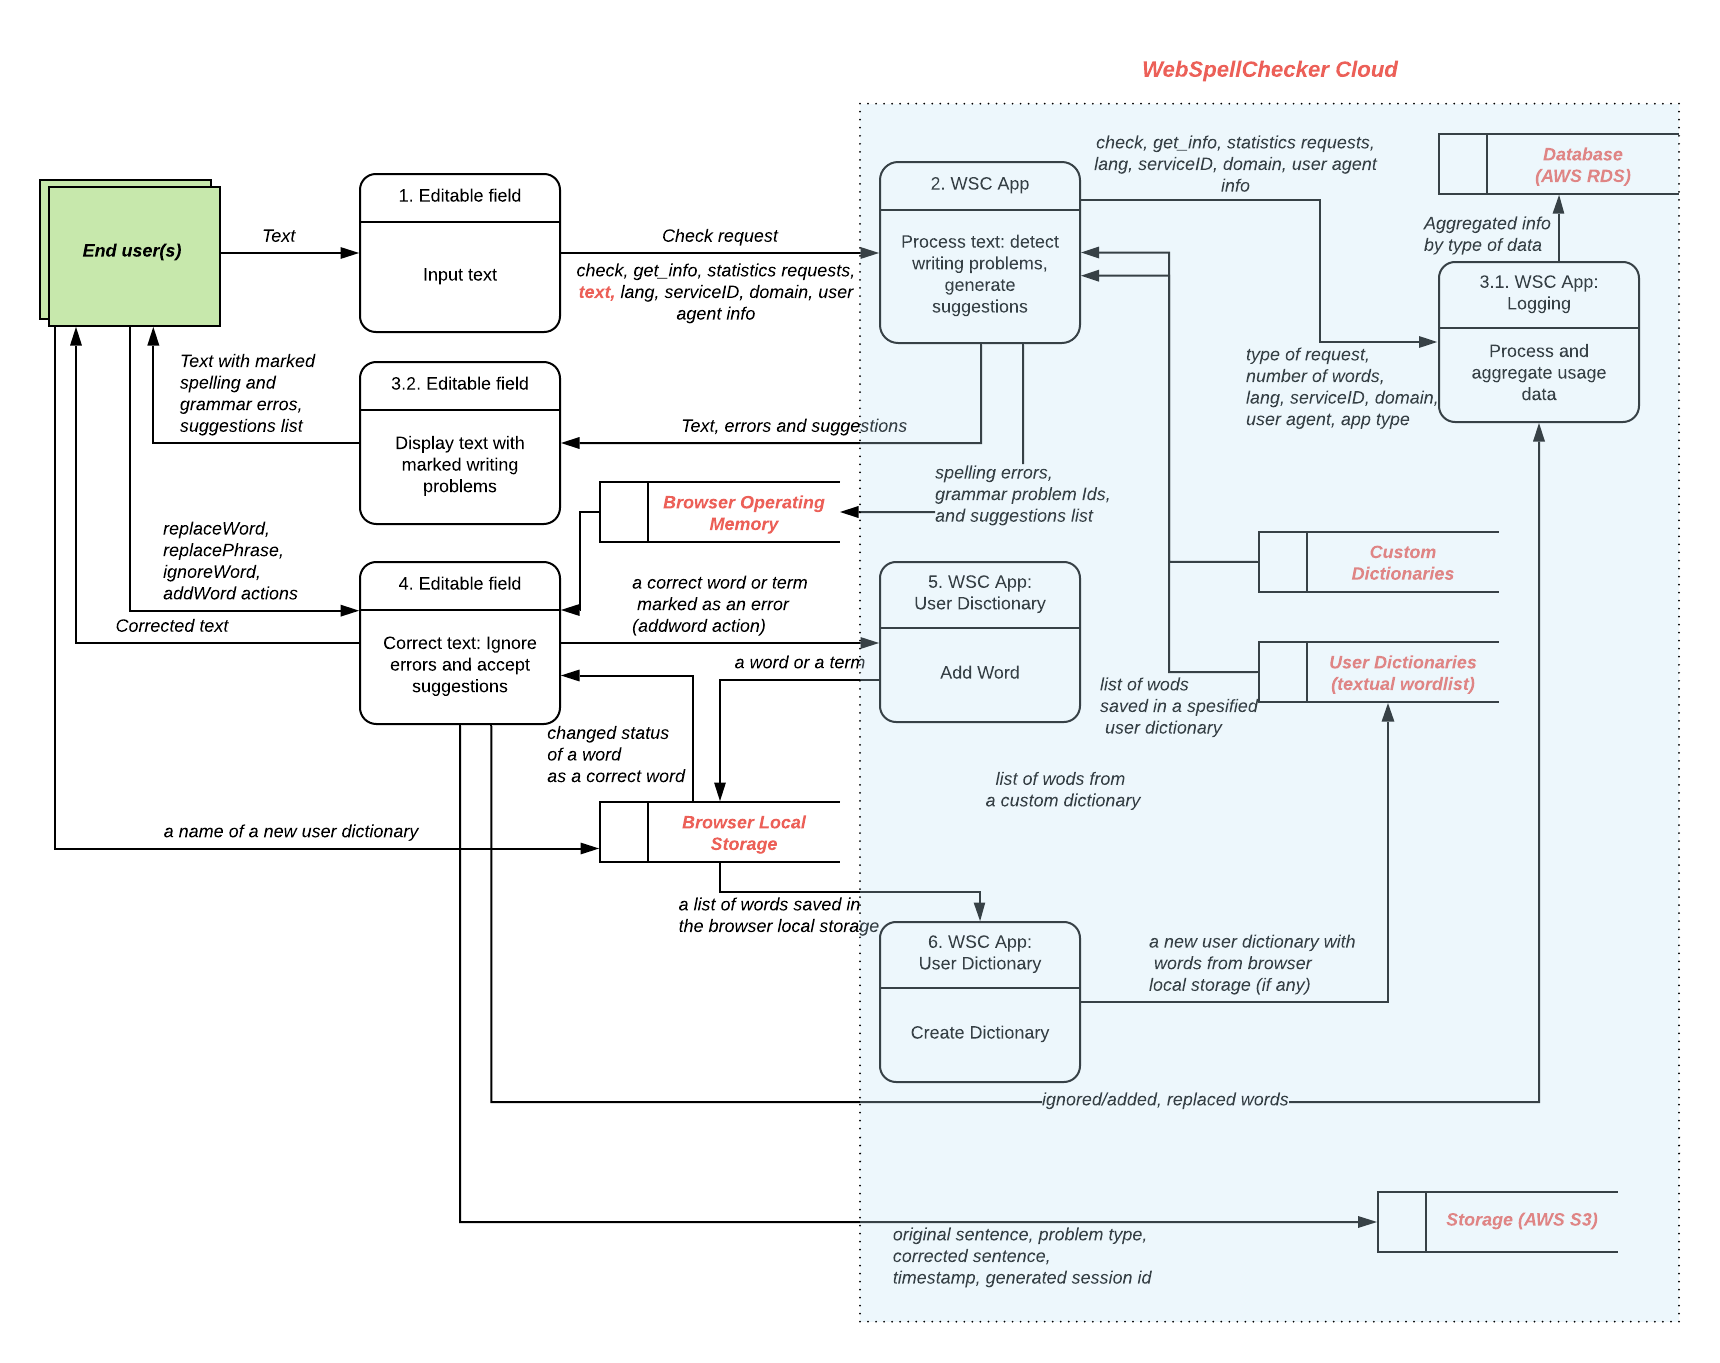
Flow Diagramflow diagram for Cloud Paid
Usersusers
| Tip | ||
|---|---|---|
| ||
|
The next diagram represents the data flow between client sessions for end users who are using the paid version of the WebSpellChecker Cloud services.

